Browser-based graphing calculator
When I attended college, I took a course in JavaScript to get a basic introduction to web development. Initially, I wasn’t very interested in web development, but JavaScript is a popular language, and I figured it made sense to learn something about it. It seemed more widely used than some languages I had studied, like C++. Learning JavaScript was a bit challenging, not because the syntax was drastically different, but because much of its functionality was intertwined with HTML. This symbiosis made the connection between JavaScript and the internet very clear, as the programs we ran in class were all executed in our web browsers. This was a welcome change compared to C, where one had to use an IDE or terminal to compile and debug code, with output displayed as text. Writing in JavaScript felt much more engaging because you could create something interactive through a graphical interface (that you built yourself!). This interactivity was far more appealing than a command-line interface.

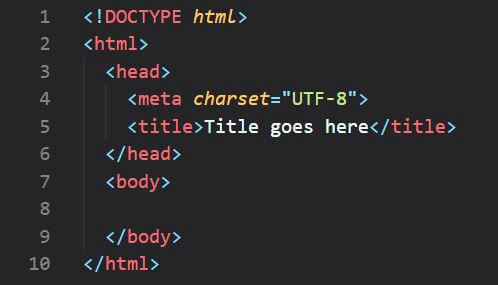
HTML creates a interface based on nested tags
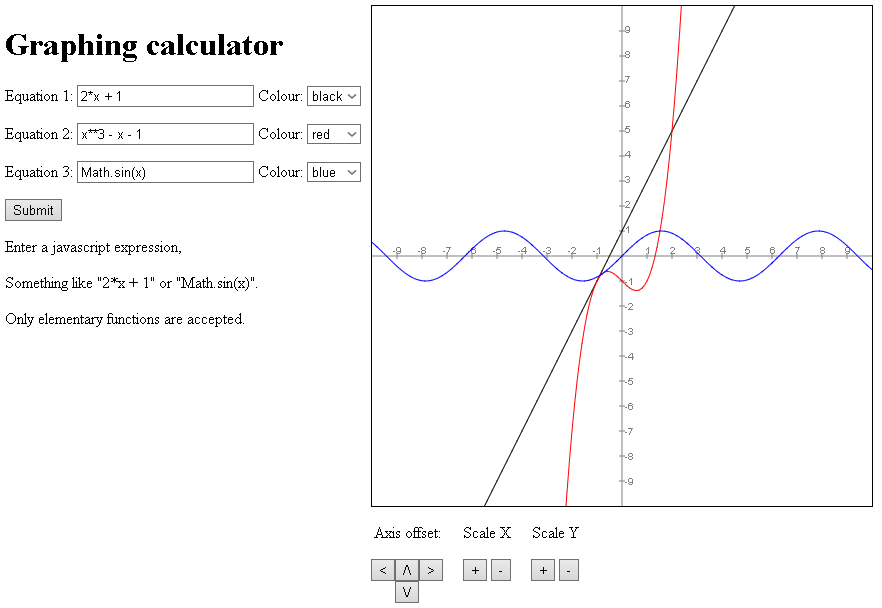
As is common in programming courses, part of the grade for this JavaScript course involved a final project. I decided to create a graphing calculator that could run in a web browser. I liked this project because it was highly visual. The user interacted with multiple buttons, and the output was vivid, allowing the user to explore the output. At the core of the program was the HTML Canvas tag, which enabled me to use JavaScript to create the curves and lines needed for the plots. Through a set of buttons, the JavaScript program translated user input to manipulate the graph’s axes, including zooming in or out and translating the graph along the x or y axes. The program’s functionality was divided into two sections: one for plotting the axes and another for graphing the curves based on user inputs. Users could input up to three equations simultaneously to prevent the program from becoming too complicated. Each equation was then restricted to elementary functions, as I wanted to avoid importing external libraries like math.js to perform more complex operations. Despite these limitations, the calculator could handle a wide variety of graphs. Here is what the output and user interface looked like:

The completed calculator had a multiple buttons to interact with
I was really pleased with the final result. While it wasn’t the most visually appealing application—since the HTML was unformatted and used very little CSS—it worked as expected. This project also served as a great introduction to the concept of feature creep; it quickly became apparent that one could easily keep adding functions to the program, making it increasingly complicated to maintain. I remember asking someone for their thoughts on the calculator once I considered it complete, and they suggested adding additional functions. They asked, “Does the calculator do this?” or “Why doesn’t the calculator have this feature?” and things of this nature. This experience highlighted that user demands often extend beyond initial expectations, underscoring the need for a clear understanding of the program’s goals. Otherwise, requests for new features can become endless.
GitHub repository
To use the calculator, simply visit the project page of this project. Alternatively, you can download the files from the repository and open the “index.html” file with your browser to use the calculator.